Google Trends
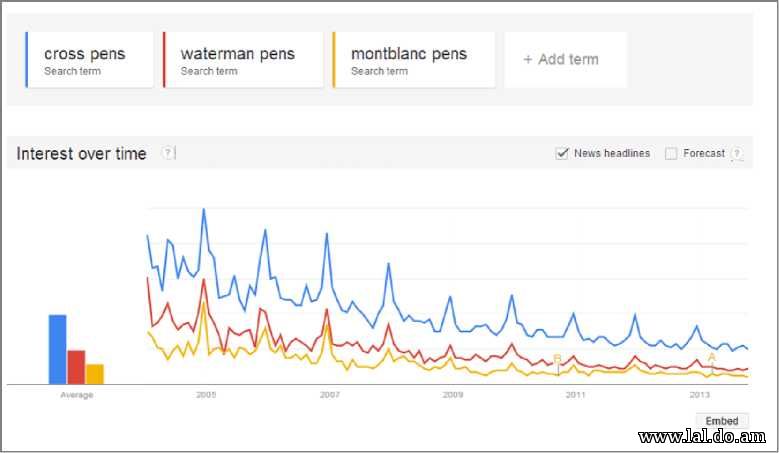
Google Trends (www.google.com/trends) is a tool that lets you see how search queries have risen and fallen over time. You can gain many insights by examining the trends of search queries. In an online world, it is easy to forget the lessons taught through hundreds of years of data from the offline world. A brick-and-mortar store has a limited amount of inventory. Each month they have to consider the goods that will need to be stocked in the upcoming months based on what will sell in the store. If a store stocks goods that are not sold, that wasted space can lead to a loss of profits. The inventory specialist examines what goods were sold in the previous years in order to predict the inventory they need in the store in any given month. Almost every business has some seasonality. Seasonality in the flower industry is one of the most obvious. Valentine’s Day, Mother’s Day, Easter, and similar holidays have correlations with spikes in searches, sales, and even conversion rates. Even an office supply store will see trends in its sales. During various holidays, spikes will occur in the number of searches for holiday stationery and printable cards. At Father’s Day, it is common to see a spike for Cross pens, a popular Father’s Day gift. During Christmas, high-end pens such as Waterman or Montblanc see search spikes (see Figure 3.27), even though overall trends for buying luxury pens have decreased significantly in the past several years.
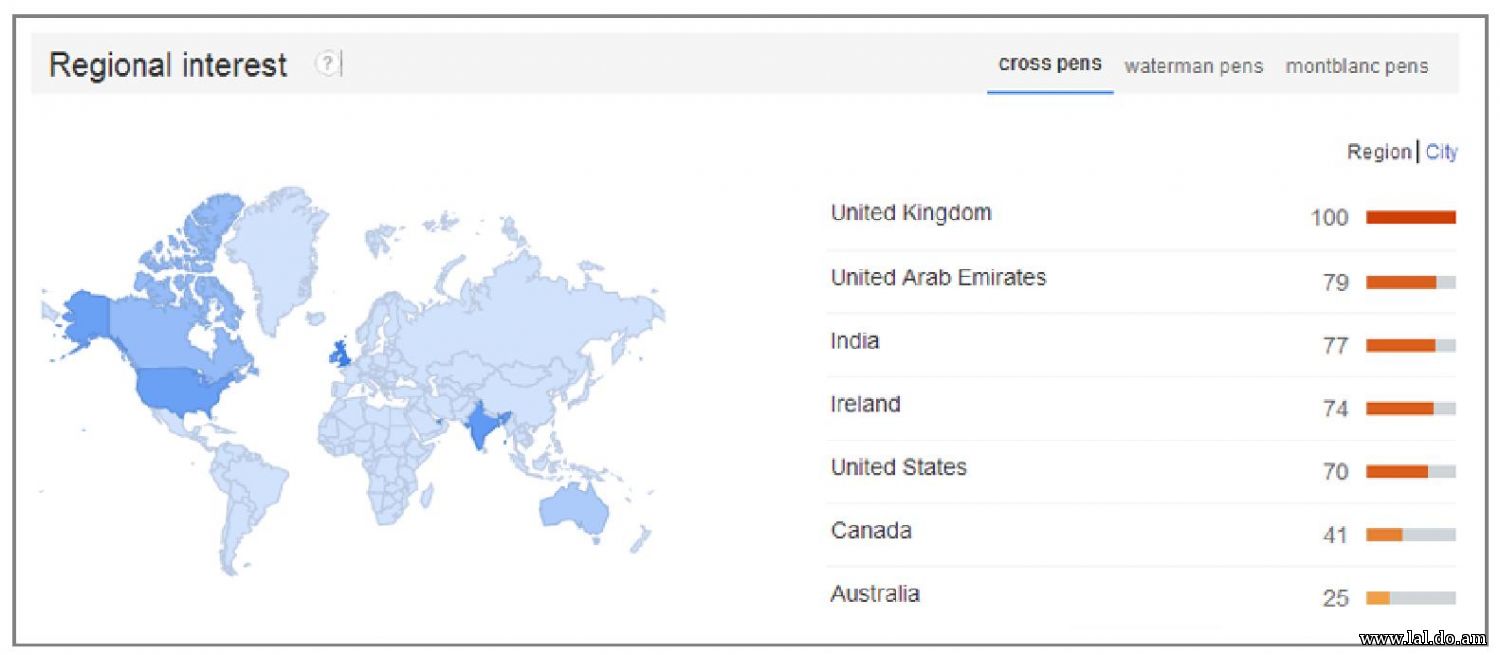
Figure 3.27 Trend data for Cross, Waterman, and Montblanc pens Not all seasonality is driven by holidays. An office supply store will want to stock low-cost laptops and computer desks in the fall when the college semester starts. It is always important to keep in mind the daily factors of life that drive search and buying behavior. When you examine AdWords reports, which we will cover throughout this book, you are always looking back in time at data. If you are making bid or budget decisions by utilizing only the past month or two of data, you are missing possible changes in conversion rates and search behavior that are driven by trends that may occur only a few times a year. If you sell computer desks, it can be useful to make changes to your inventory and ad copy based on the fall back-to-school season versus the spring, when both people and businesses move and need new furniture. Instead of making changes based on your account’s past history, examine the history to project changes to conversion rates, sales, bids, and budgets. This is where Google Trends shines. It is a free tool that will display changes in keyword search volume or even in visitors to a website. You can segment this data by various time frames and by regions. Once you have the data, you can click into a region to drill down into states and cities. The most important thing to note when examining the region, city, and language data is that it is normalized by population (see Figure 3.28). The data shows the likelihood of that search term being used in that language or region. In the chart shown in Figure 3.28, the data does not mean that Ireland and the United Kingdom conduct more searches for Cross pens than the United States. It means there is a higher chance of a user in one of those countries searching for a Cross pen than in the United States.
Figure 3.28 Search trend information normalized by population You can refine the data within Google Trends in several ways:
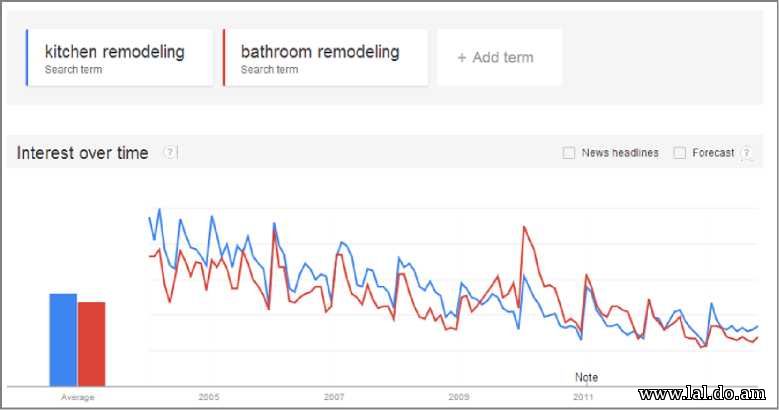
Most of those criteria are self-explanatory. However, the one to draw additional attention to is the Category filter. When you use the Category filter, the tool will show you only the change in volume for that specific category. This is useful when a term can fall into multiple categories and your products or services are based within a single category. There are several useful ways of using Google Trends based on the type of information you need to know. Let’s look at a few examples of how to use the tool to gain insights into your marketing activities. What Services Should You Offer? If you have several services, it would be useful to know which ones have higher search volumes and how those volumes change so you know where to focus your online marketing efforts. With Google Trends, it is easy to compare several items to see which has a higher search volume and if there are definitive trends. If you are a plumber who specializes in kitchen and bathroom remodeling, where should you spend more time optimizing your search marketing (see Figure 3.29)?
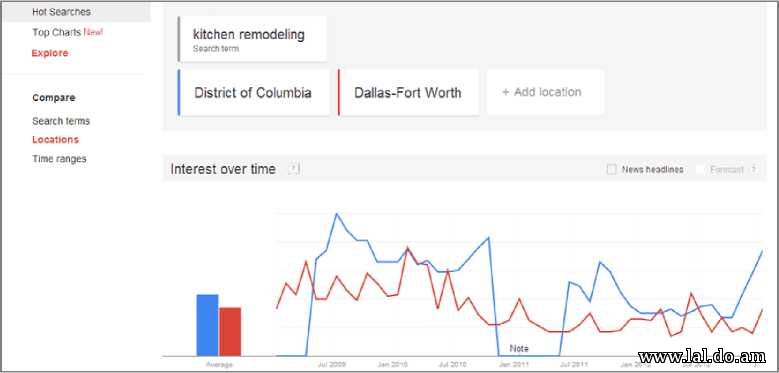
Figure 3.29 Kitchen remodeling vs. bathroom remodeling search information In Figure 3.29, you can clearly see that the trends for kitchen remodeling and bathroom remodeling are similar. Before 2009, kitchen remodeling had a higher search volume. Starting in 2009, bathroom remodeling took over the higher search volume of the two options. By examining trend data, you can see that you should have switched your focus from kitchens to bathrooms in 2009. What happened with the collapse of the real estate market is that people wanted to remodel to sell their homes. However, bathrooms are much cheaper to remodel than kitchens. Therefore, advice from real estate agents became redo the bathroom instead of the older advice of redo the kitchen in order to get the house ready to sell. Although it is useful to bid on both of these terms, there is a higher possible payoff when you focus more attention on bathroom remodeling because the search volume is higher. More drill-downs are available on the page. Below the search volume chart is a chart that shows regions and a heat map based on the search volume in various regions. You can view this information at a country, region (state), or city level. If you tailor your search campaigns for geographic regions (which will be covered in depth in Chapter 11), you can gain more insight by drilling down into various regions. For instance, you can look at the initial data and see that there are a few locations that appear to have a higher interest in kitchen remodeling than bathroom remodeling. You can then use the locations search feature (Figure 3.30) to compare a search term in multiple geographies at once. For instance, if you were a Washington, DC, plumber, it would be useful to know that Washington is one of the few regions where there is more search volume for kitchen remodeling than bathroom remodeling (see Figure 3.30). Therefore, a Washington plumber might focus his campaign differently than a Dallas plumber, who sees the exact opposite in terms of top searches.
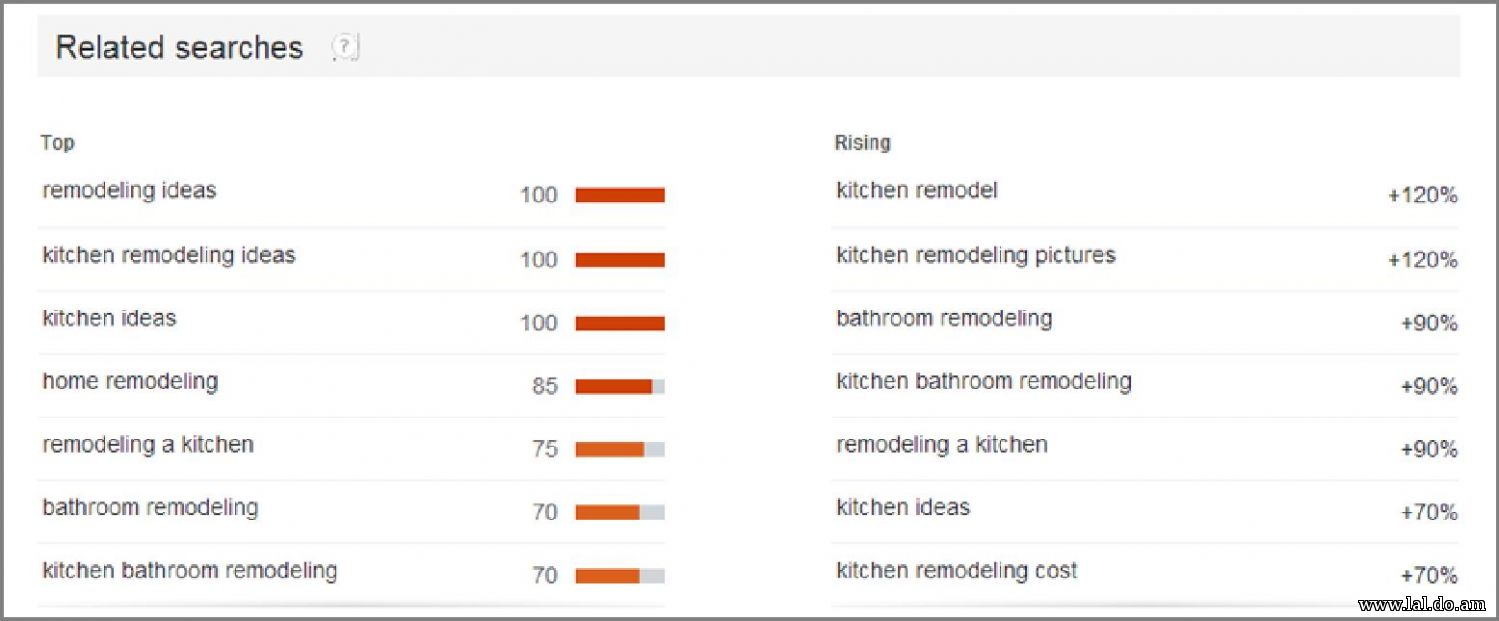
Figure 3.30 Kitchen remodeling search volume Lastly, at the bottom of the Google Trends page, you can find related information about top searches and raising searches. The top searches are just what they sound like—the top searched keywords related to the keywords you chose and the geographic region. If you choose different regions, you may see the top related searches change as well. The top gaining searches are words that have gained in popularity based on the time frame you chose. It is useful to select the past year, or even the past 90 days in a quick-changing industry, to see what additional words are gaining in search volume. This can be useful to determine whether there are new products you should offer (see Figure 3.31). Occasionally you may see a word labeled breakout. This means the search volume has changed by more than 5,000 percent. If it is related to your business, it is a trend you want to make sure your company is aware of and possibly testing.
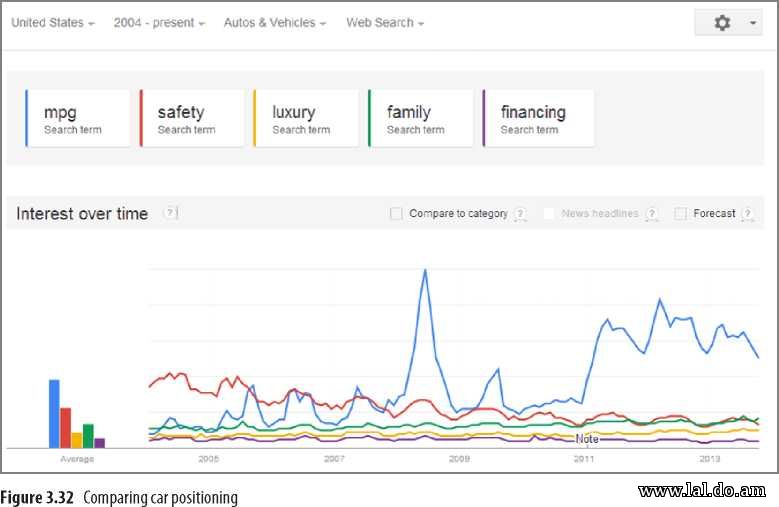
Figure 3.31 Top searches and rising searches for kitchen remodeling In this case, you see that some of the top rising searches involve kitchen remodeling pictures and kitchen remodeling costs. Therefore, including these words in your keyword list and showing some pictures and cost estimates on your landing page are good ideas. Determining Your Messaging If you are selling cars, should you promote a family car or a luxury car? What about car safety versus fuel efficiency versus financing? If you could compare the search volume for these different aspects of a product, it could help you decide how to position your product, as shown in Figure 3.32. In Figure 3.32, you can see that the search volume changes slightly for family versus luxury cars, with family cars having a slight edge. This might not be enough of a difference for you to change your product positioning.
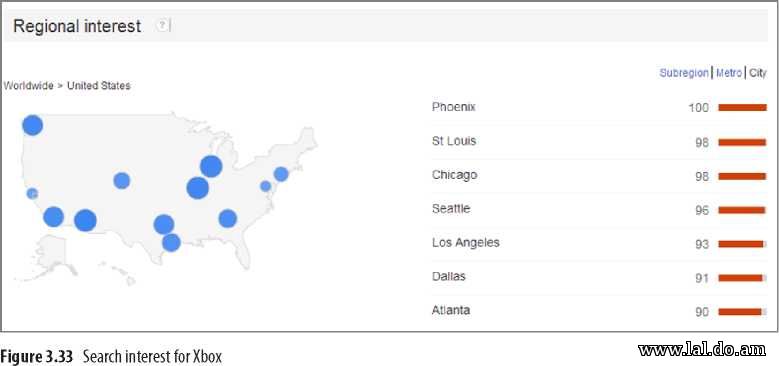
However, it becomes easy to see that gas mileage is much more important than either safety or auto financing. Several years ago, car safety was the most important aspect of buying a car. From 2005 to 2008, safety and gas mileage vied back and forth for the top searches. Starting in 2008 with the change in the economy, gas mileage has consistently beaten other aspects of car buying. By comparing features of your products, you can see which features have higher search volume and are often a larger consumer concern. This knowledge can help shape your ad copy and landing pages to address the consumer’s greatest questions. Determining Consumer Interest If you are expanding your market, knowing which areas have a greater interest in your product can help you create test markets and determine where your expansions will have the best chance for success. For example, if you created an add-on for the popular Microsoft Xbox game console, where should you market your product? You could attempt to look at market interest by individual city or by country. How much do you want to expand your marketplace? By comparing searches for Xbox across different geographies (see Figure 3.33), you can determine a list of regions where the interest for Xbox is high. Because Google Insights for Search shows interest, and not total search volume, you will need to reference this information with the actual population size, but Google Insights for Search creates a much easier starting place for your additional research.
There are many other creative ways you can use Google Trends. Whenever you are conducting research that involves keywords, locations, or trends, keep it in mind to see how you can use this tool to help with your research. © Advanced Google Adwords: 3rd edition >>> Back to TABLE OF CONTENTS <<< | |
| Views: 539 | Comments: 1 | |
| Total comments: 1 | |

| |